Blackwell Properties: Real Estate Executive Dashboard
A real time executive dashboard for a luxury real estate brokerage giving the principal full visibility across broker performance, deal pipeline, and an $847M+ property portfolio.


Luke Wilson
Founder & CEO
Case Studies
2 Min Read
The Problem
Running a luxury real estate brokerage with multiple brokers and a large property portfolio means constantly juggling performance data, deal pipelines, commission targets, and property status across tools that were never designed to work together.
Without a single source of truth, the principal is always one step behind. Checking on broker performance means pulling a CRM report. Understanding pipeline value means opening a spreadsheet. Getting a clear picture of how the business is tracking against annual targets means compiling everything manually. It is operational noise when clarity is what is actually needed.
What We Built
A real time executive dashboard giving a luxury real estate principal full visibility across the entire brokerage operation:
Overview with six headline KPIs covering portfolio value, commission year to date, active listings, deals closed, average days on market, and list to sale ratio alongside a revenue versus annual target chart and a needs attention alert feed
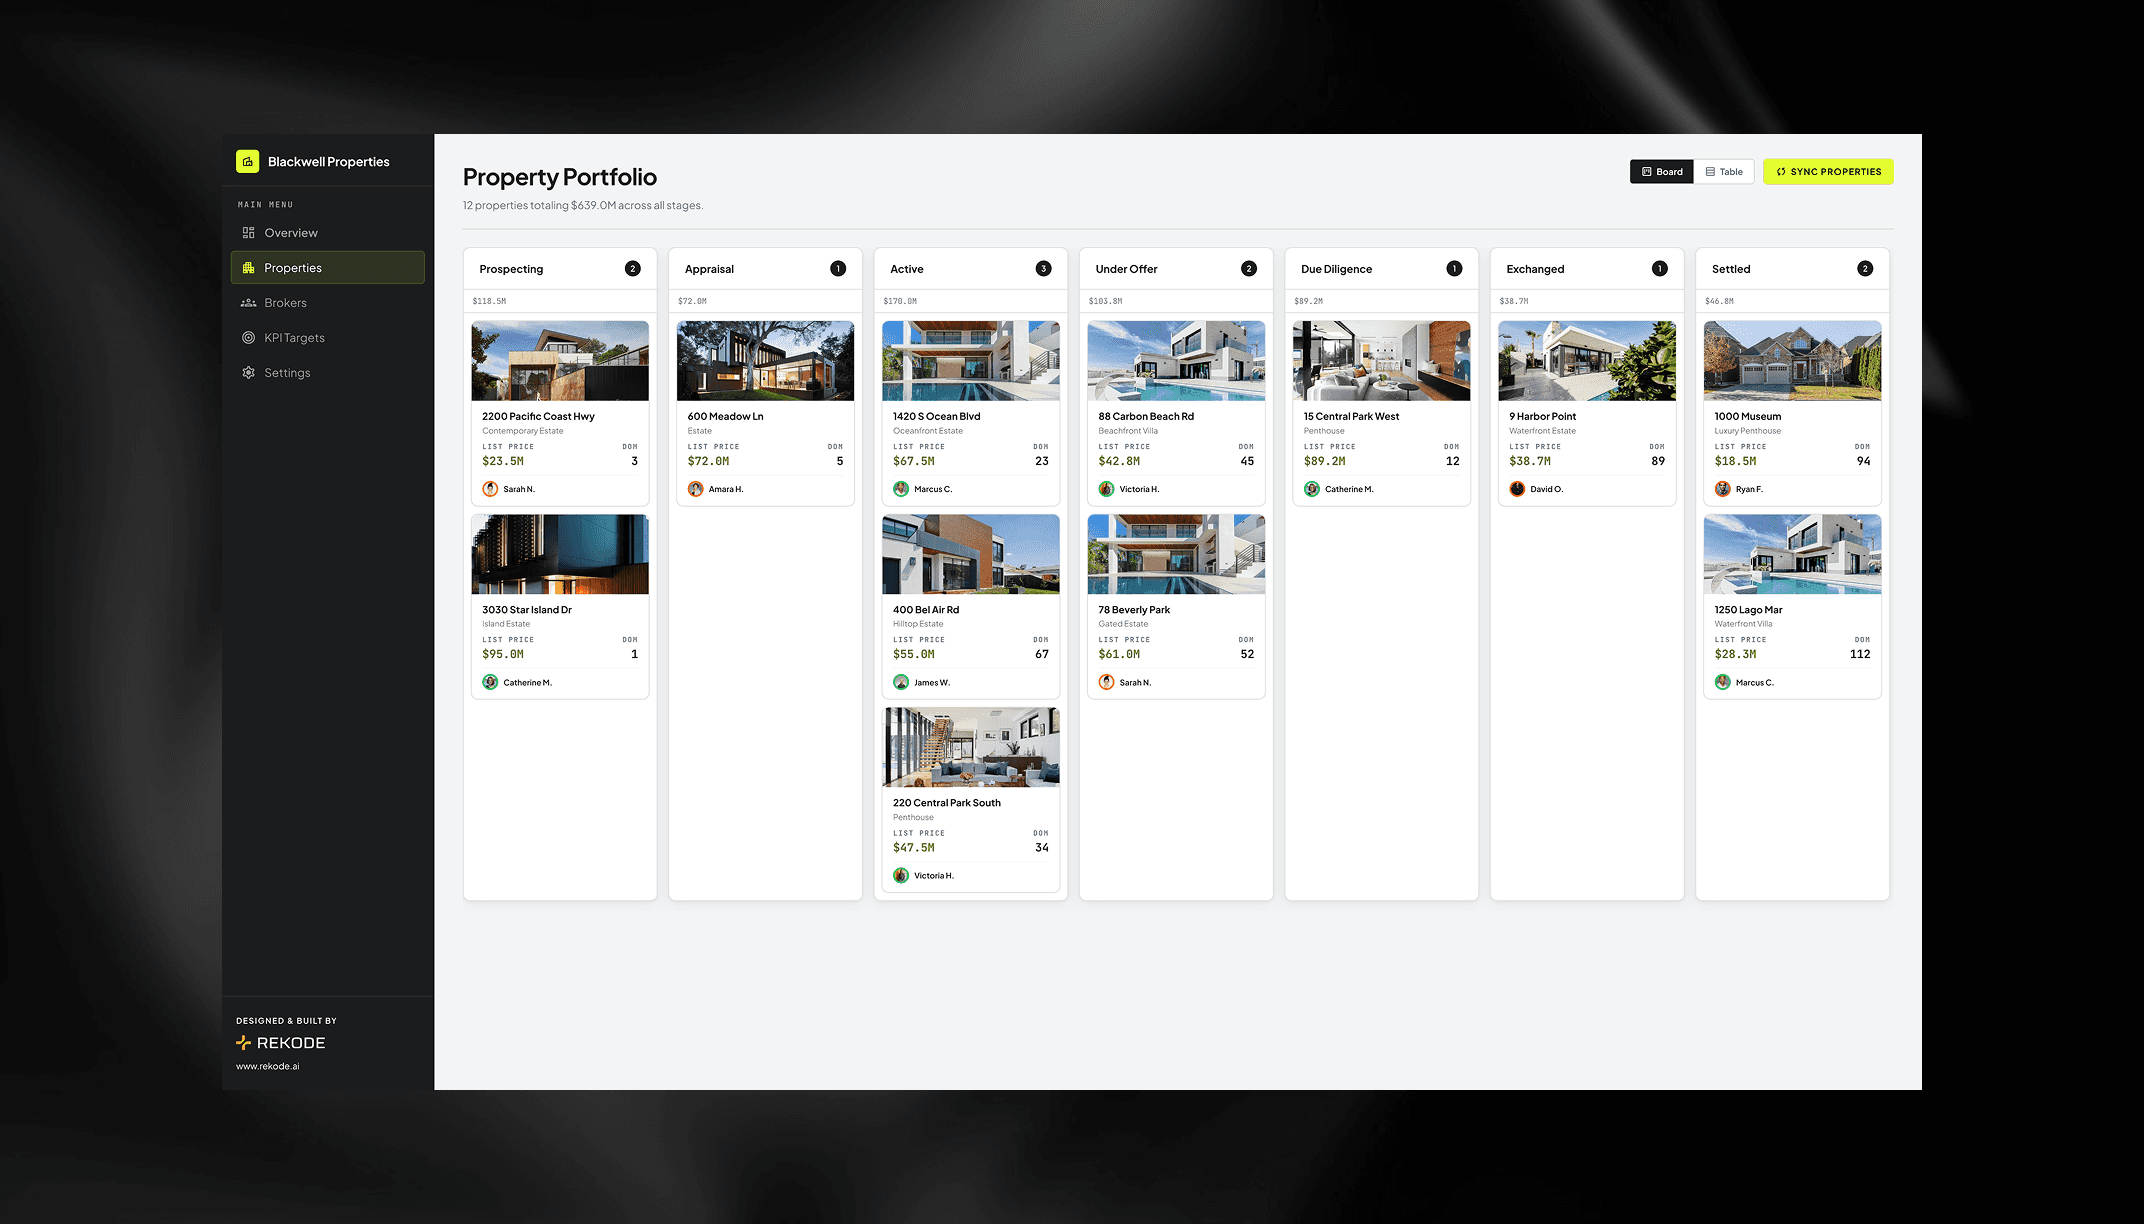
Property portfolio with a kanban board across seven pipeline stages from Prospecting through to Settled, with drag and drop functionality, property detail modals, offer tracking, and broker assignment
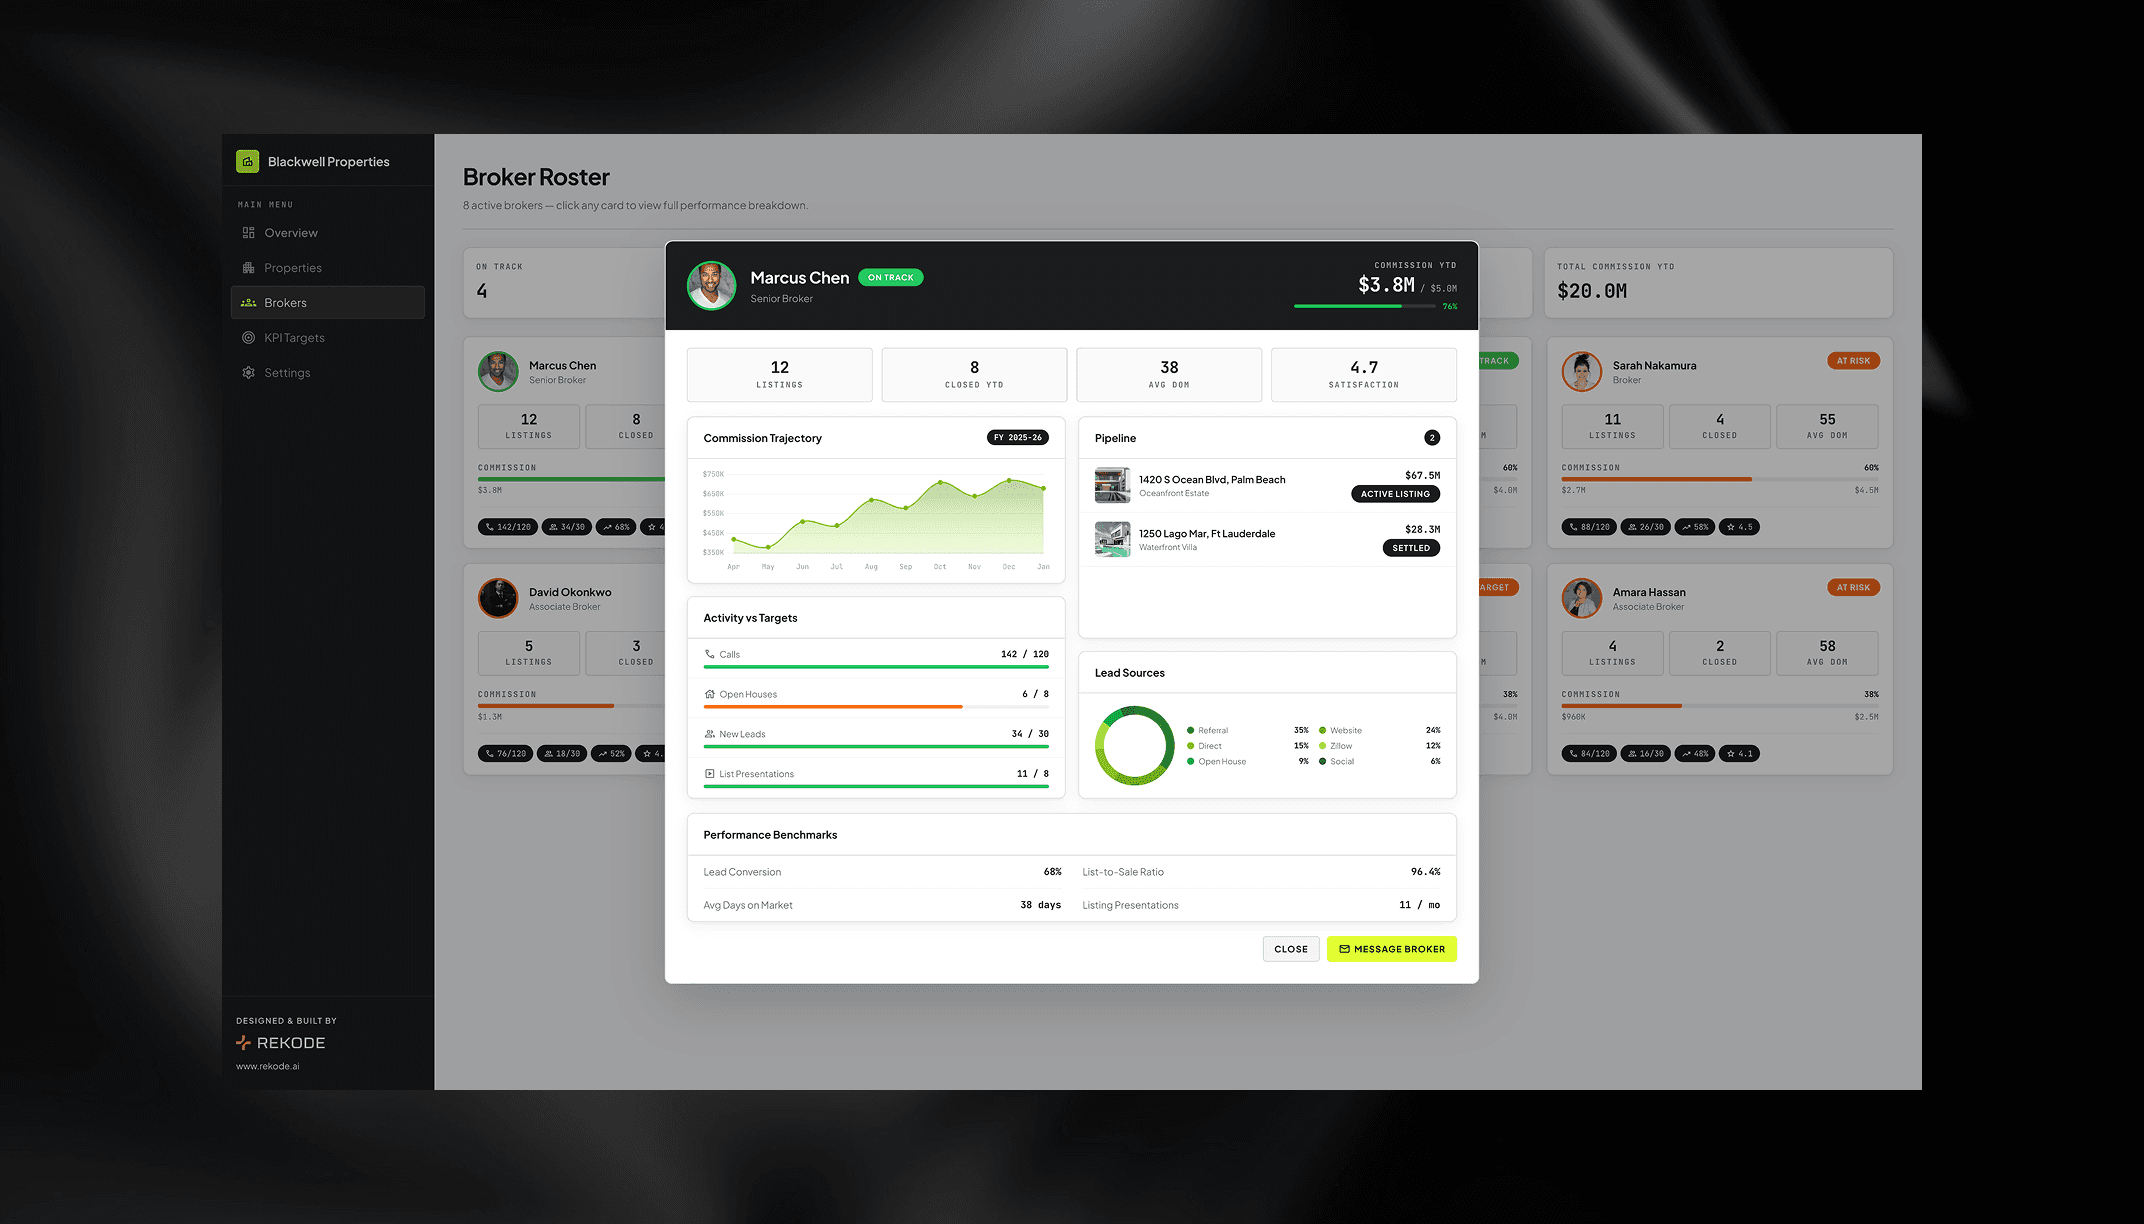
Broker performance cards showing commission progress, activity metrics, and status across On Track, At Risk, and Below Target with deep dive modals covering commission trajectory, lead sources, and pipeline
KPI targets with brokerage wide target management, health status tracking across all brokers, and the ability to add new metrics
Settings covering company profile, notification preferences, and user management
How It Works
From the overview the principal can see at a glance how the brokerage is tracking against annual targets, which brokers need attention, and where the highest value deals sit in the pipeline. Clicking into any broker opens a full performance deep dive with commission trajectory, lead sources, and a breakdown of their active pipeline.
The property kanban gives a visual overview of every active listing across all pipeline stages. Dragging a property to a new stage updates its status across the entire dashboard instantly. Every data point is internally consistent so the numbers always tell a coherent story.
The Outcome
A single screen command centre that gives a real estate principal full visibility across broker performance, deal pipeline, and portfolio status without operational noise. Everything needed to make fast, informed decisions in one place without digging through reports.


